Office of Institutional Effectiveness
Quick Stats - Alumni and Donors
Data Source: University AdvancementAfter viewing the following charts, if you want to learn more about Alumni or Donors, visit:
Figure 1: Seattle Pacific Alumni
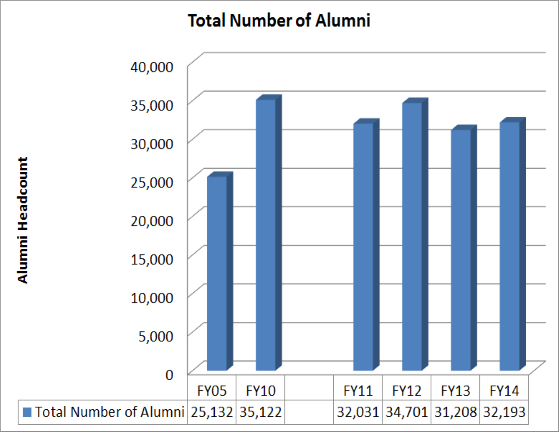
Figure 2: Individual Donors - Alumni and Non-Alumni
Fiscal Year 2014 (ends June 2014)
- 67% increased giving
- 18% remained at the same level
- 15% decreased giving
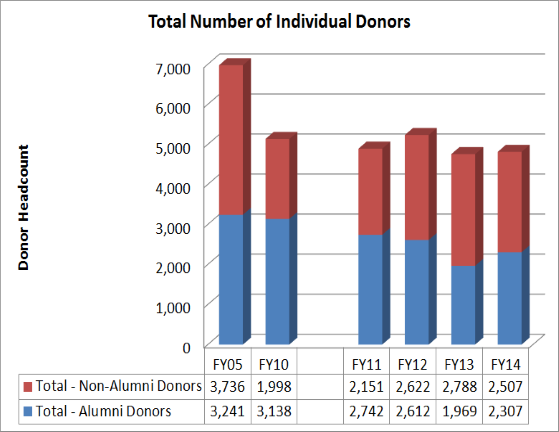
Figure 3: Total Income and Income by Source
- FY 05 Total Income: $10.29 million
- FY 14 Total Income: $6.7 million
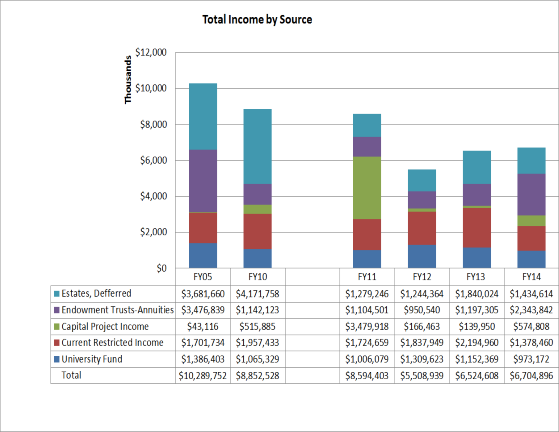
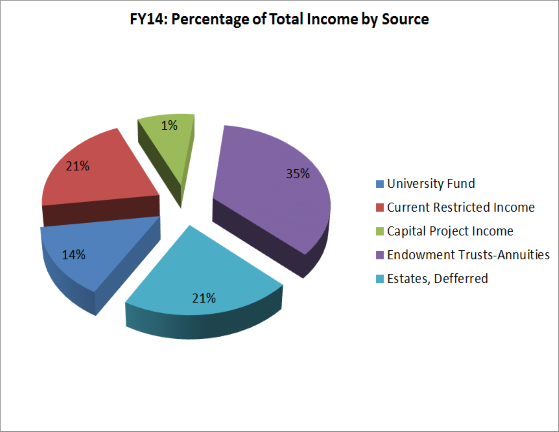
Figure 4: Percentage of Income by Source - Fiscal Year 2014 (ends June 2014).
Links
Resources:
More about SPU
Do you have questions?
Unable to find what you’re looking for? Let us know.
For computer related questions, contact Computer and Information Systems (CIS).